Dave Wilson recently sent in another batch of targets and data; this time, the subject remains the 32 S&W Long but with a different powder- Alliant’s Sport Pistol.
Sanity Check:
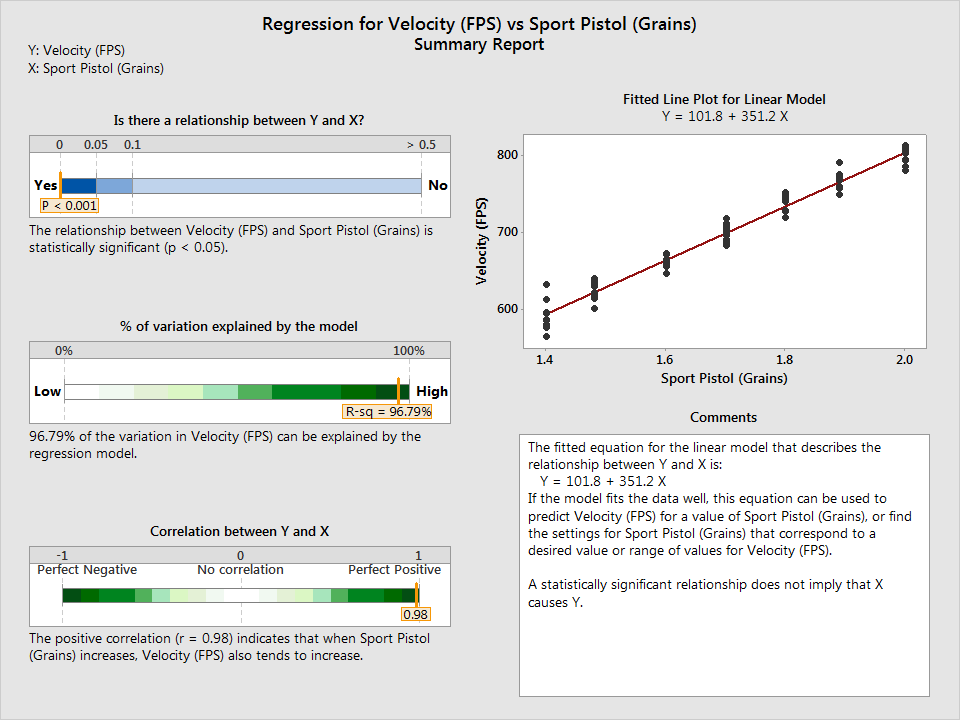
- Increasing the powder charge increases velocity.
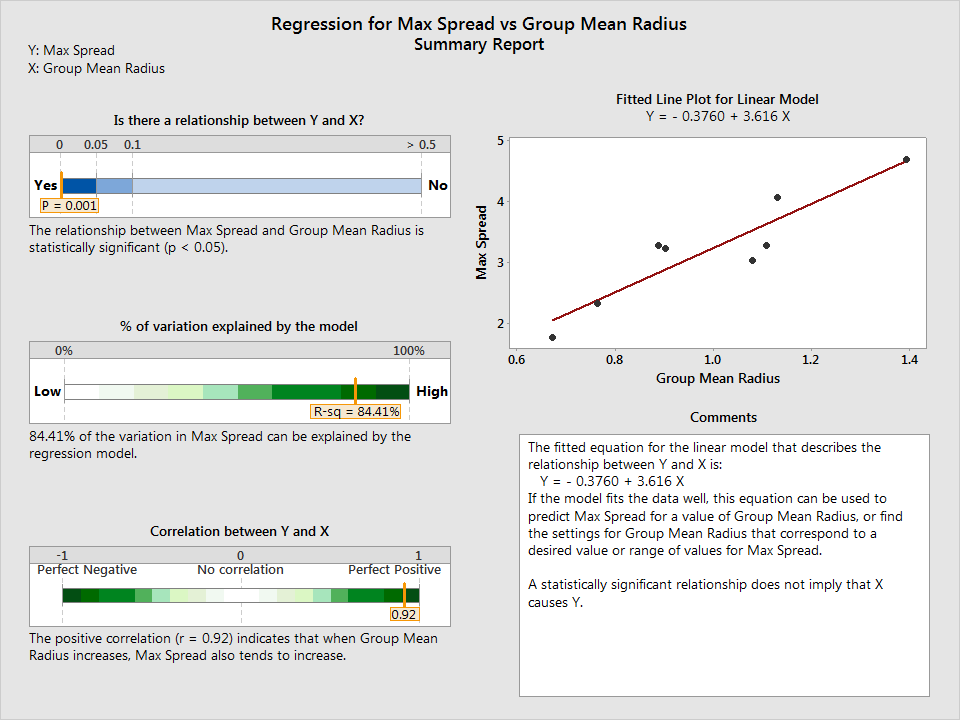
- The larger the extreme spread of a group, the larger the mean radius.
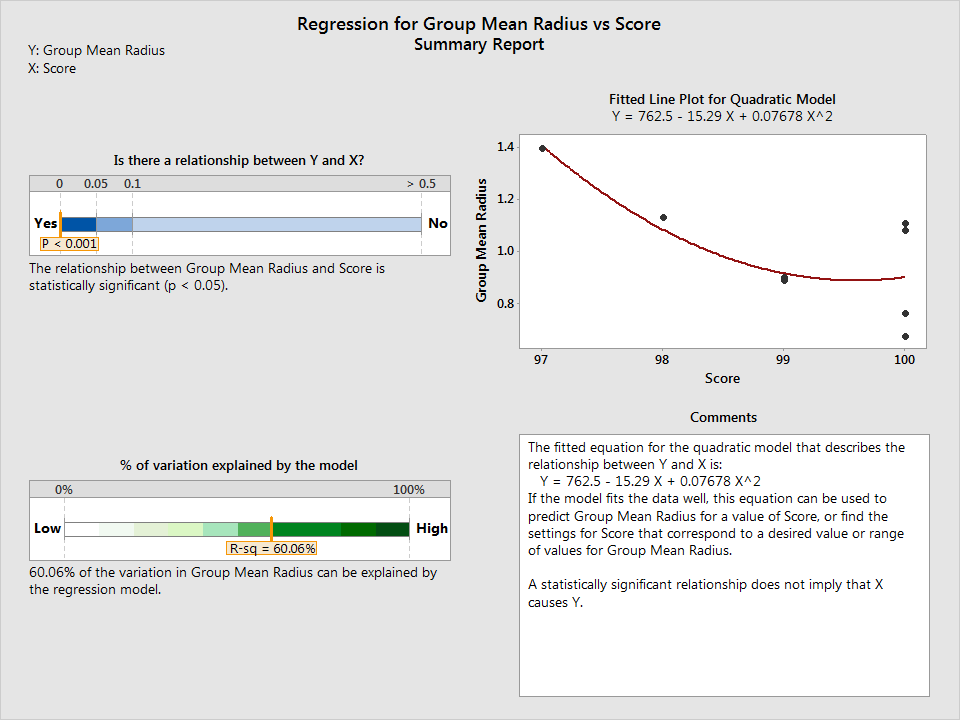
- The lower the score, the larger the mean radius.
The expected results were found in the data. Increasing the powder charge increases velocity:
The larger the extreme spread of a group, the larger the mean radius:
The lower the score, the larger the mean radius:
After passing the sanity check, further examination of the data revealed some interesting results regarding the relationship between group mean radius and velocity. Even more interesting is the revelation regarding the statistical power of the members of the sample group, which was demonstrated from some data manipulation due to an interesting artifact of this dataset and will be discussed further below.
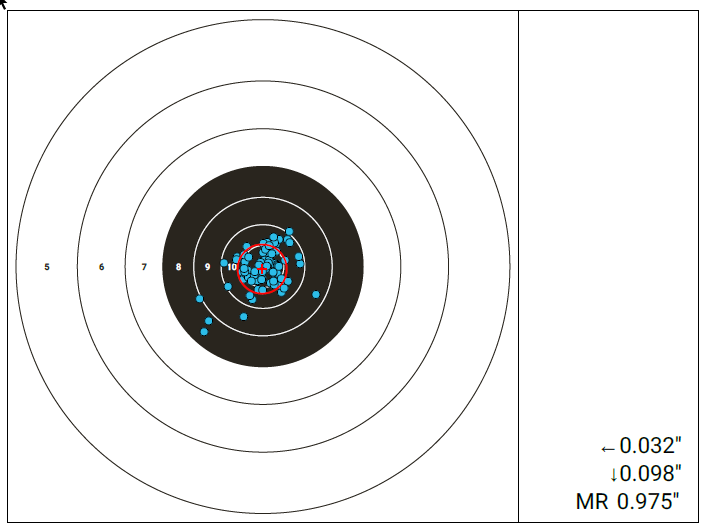
The composite target score came in 793-55X, with a mean radius of .975″ and a max spread of 5.239″. The score, expressed as a percentage, comes in at 99.12%, which is 0.3% lower than the previous score from the earlier BE-86 test.
The mean radius for Sport Pistol was approximately .07″ larger than BE-86; but both are still below an inch. There is not enough information at present to demonstrate, one way or another, that there is any significant difference in score or mean radius due solely to powder choice. A numbers check would indicate that BE-86 is the better powder(795-52X, .901″ MR) in the 32 S&W Long, but at mere tenth’s of a percent improvement in score, and no larger set of data from which to pull, the main differentiation is between the mean radius between the two aggregate groups, and both are still below an inch, with the nod going again to BE-86. That’s the practical take away based on the data presented.
It should be noted that this report is provisional in nature and very much subject to revision due to potential data collected in the future. But based on what has been presented thus far, with the caveat about sample size cloudiness, if you had to pick between BE-86 and Sport Pistol, you’d be better off with the BE-86.
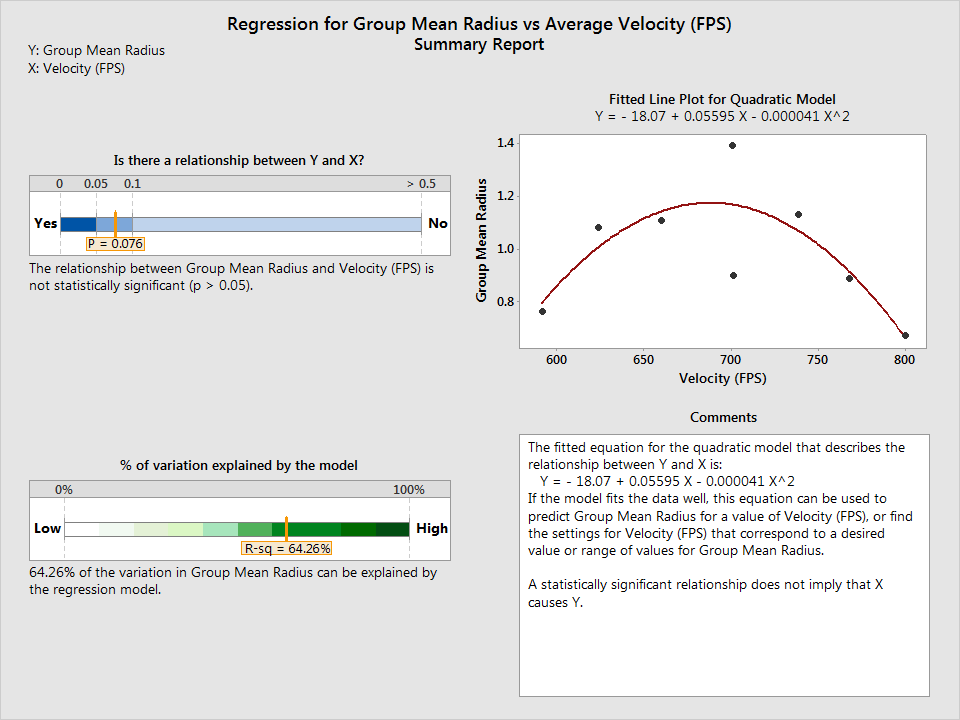
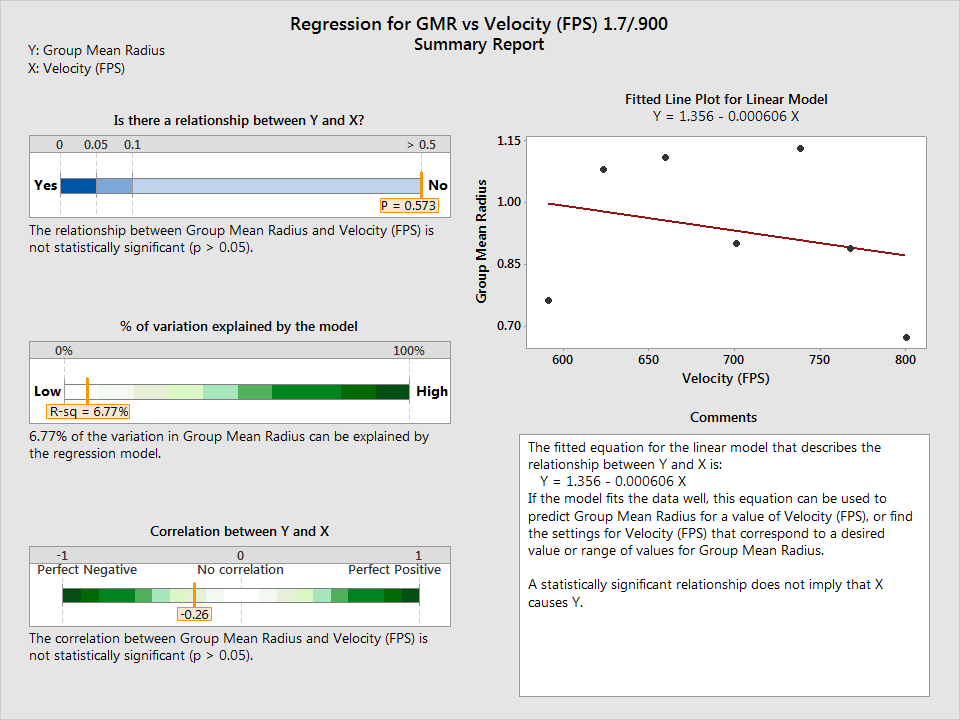
The last bit of information that should be of interest is the distribution of the data. Specifically, 1.7 grains of Sport Pistol was tested twice. This, in and of itself, isn’t a big deal. However, when I was looking at the following curve:
… my curiosity was piqued. It wasn’t so much the two data points around 700 FPS that had such a jump between them, but instead my attention was drawn to the other two charts. It was beginning to look like it could very well be the case that velocity and mean group size could be related, something I don’t presently believe and was at a loss for how to explain such a relationship if it existed here.
One way to think about these sorts of relationships between two seemingly related variables is to remember that there could very well be a correlation between the number of shark attacks in a year with the amount of people who defect from North Korea during the same period. Such a relationship might pass the stats tests, but on its face, it fails- there is no relationship between shark attacks and North Korean defections in a year other than coincidence.
But in this case, I still have the math to contend with. You’ll note in the first left hand chart that while it goes on to say that there is no statistical relationship at the .05 level (the standard often used to benchmark a relationship between two variables), the marker is trending that way. What’s worse, is that the R-sq in the lower left hand graph was tending towards dark green; once about 65% of the variation in the data can be accounted for in a regression model, you need to be careful about what sorts of conclusions and inferences you draw from the data itself.
So, in order to show what I thought was going on- that it is the sample size itself that can easily skew resulting interpretations, I made up a few scenarios.
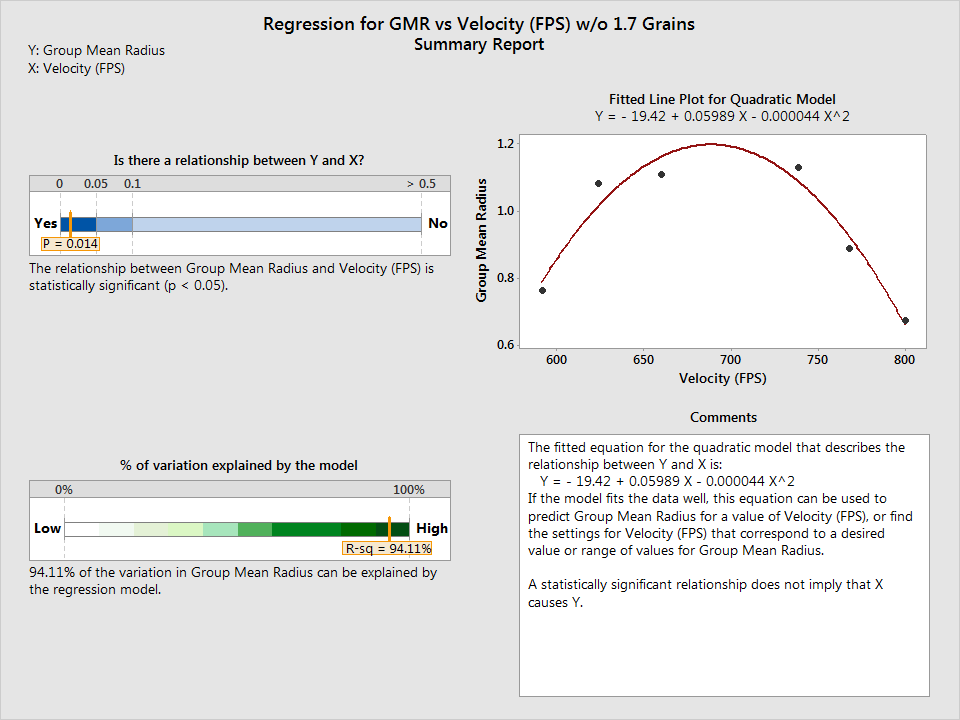
- What happens if I take both 1.7 grain tests out of the data completely (in other words, pulling the peak and trough out and “fit the line” by eye)?
Then all of a sudden I’ve got a super confident relationship that is fit very well by the data.
- What happens if I take the lower mean radius of the 1.7 grain tests out of the data completely (in other words, pulling the trough out and “fit the line” by eye)?
A similarly strong relationship is the result. So, now it’s starting to look like there may be some underlying relationship here- some very strong indicators that there is in fact a relationship between velocity and mean group size.
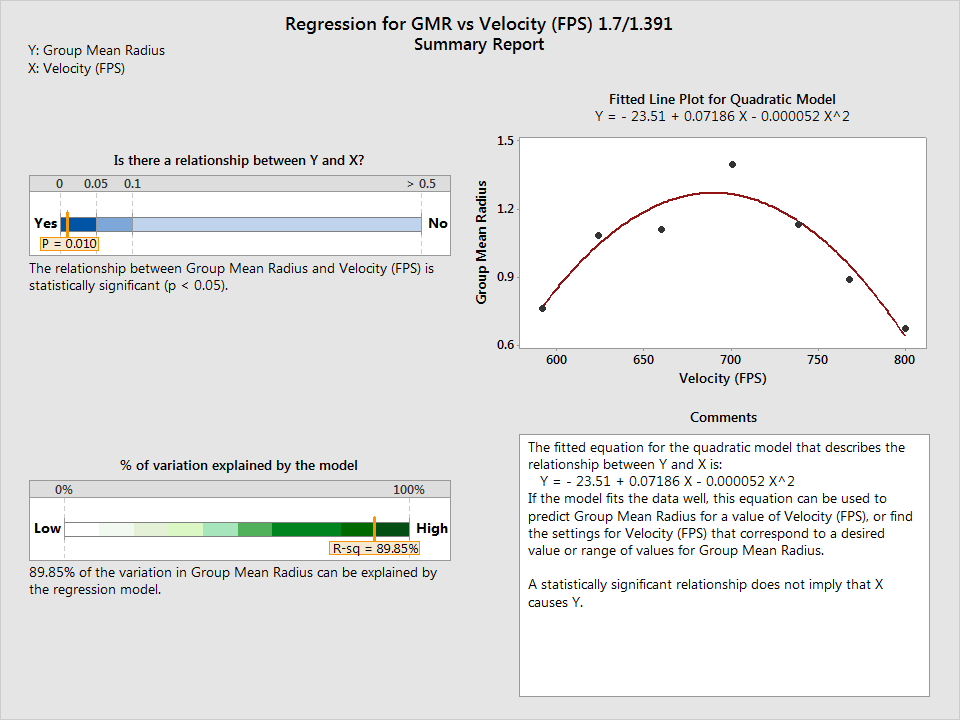
- What happens if I take the upper 1.7 grain test out of the data completely (in other words, pulling the peak out and check for fit)?
Oh dear. It looks like North Korea got overrun with sharks.
The point of these scenarios isn’t to speak about North Korea or sharks, but to highlight that the selection of data from a limited dataset can influence the output significantly. All I did was omit two data points completely, remove one data point, and remove different data point, which resulted in at least two mutually exclusive views. This is why it is important to have a lot of targets to test for what a gun is truly capable of- even with the 8 Alliant Sport Pistol targets I received, modeled, were taken cleanly, etc., it is still very likely that you won’t have robust results until you have more data.
Again- many thanks to Dave Wilson for making this data available!
