32 S&W Long Sport Pistol Analysis

Dave Wilson recently sent in another batch of targets and data; this time, the subject remains the 32 S&W Long but with a different powder- Alliant’s Sport Pistol.

Sanity Check:

  • Increasing the powder charge increases velocity.
  • The larger the extreme spread of a group, the larger the mean radius.
  • The lower the score, the larger the mean radius.

The expected results were found in the data. Increasing the powder charge increases velocity:

Continue reading “32 S&W Long Sport Pistol Analysis”

Hornady Action Pistol 185 GR Quality Measurements

I wonder about ammunition quality a lot. I even get somewhat meta about it when asking myself, “what does it mean to say ammunition is high quality?” Perhaps like Justice Potter Stewart, who reportedly said something to the effect of, “he knew pornography when he saw it,” the same idea can be expressed about quality ammunition, “I know it when I shoot it.” Of course, I’m not skilled enough to take advantage of the mechanical edge that the highest quality ammunition can provide, though I do hope to some day be able to. That would be mastery of a skill that relatively few in the world possess.

There is another reason for my curiosity. What I’d really like to know is “how does Federal consistently make high quality 45 ACP Gold Medal Match (45 GMM) ammunition that works well in most every gun?” I have a hard time believing they are doing something that the average handloader can’t either duplicate or perhaps improve upon. One way to potentially back into the answer is to use similar components, though I presume Federal knows a great deal more about running “a good lot” through the high speed machines than even the quickest of Dillon 1050s. Even so, with the proper components, I’m sure there are quality checks along the way that just aren’t feasible for the home handloader, but Federal can do as a matter of practice.

And so, in the quest to measure and compare presently made components, I picked up some repackaged Hornady Action Pistol 185 grain 45 ACP bullets from Midway USA. The reason people interested in handgun precision and accuracy tend to prefer to use hollow point constructed bullets is because the format of construction lends itself well to those qualities. They are easier to construct in a consistent fashion, which in turn leads to some degree of predictability of precision.

The Hornady name is no stranger to the shooting community. Like any reputable company, they consistently produce great products the shooting public wants while also delivering good value. The company got its start by purchasing surplus munitions equipment from the US Government after WWII, and the company has since expanded from bullet making alone to reloading tools, completed cartridges, and bringing new cartridges to market.

Measurements taken were weight, length and diameter (in that order).

Diameter:

The Hornady samples all measured .451″ in diameter.

Length:

Using digital calipers, I found very little variation- the most frequent length was .542″, with one .541″ and a few .543″. Chances are if you reach into a box of these, you’ll pull a .542″ out- very close tolerances here.

Weight:

The probability plot indicates that the sample weights reported fell within normal process bounds, though there is a little clustering due to the consistency of the bullets:

What is even more revealing than “keeping all the blue dots between the red lines,” is the distribution of weight itself. The lightest bullet measured was 184.7 grains, and the heaviest was 185.27 grains. The difference between these two points is .57 grains- this means that, even if you doubled the difference, you’d only be a little over a grain difference between bullets in the same box. Incredibly impressive that they can keep tolerances to just a hair over half a grain difference between lightest and heaviest.

Put in practical terms- assuming two bullets were pulled from the same box and were constructed equally, loaded the same, and then shot from a test fixture of your choice, there would be negligible difference in point of impact, all things being equal.

Relationship Between Weight vs Length:

A regression analysis indicates that there is a relationship between weight and length, but they are not particularly strongly related with one another, as Pearson’s coefficient is low- 11.06%. This is most likely due to the tight distribution of lengths to model the corresponding weights.

Conclusion:

In general, these bullets appear to be well made and arrived in excellent shape. On average, these bullets are exactly 185 grains- which, if you have been following these notes of mine, makes my heart warm with joy. These bullets have had the lowest standard deviation in weight of any bullets measured thus far, and this consistency will not be a detriment. These bullets appear to be constrained in terms of their length, as they have been the most tightly spaced of any measured thus far. Like the Nosler and Sierra bullets previously measured, this tightly controlled length may help keep bullet seating repeatable and crimping consistent. This in turn may explain why these bullets could be excellent performers for 50 yard bullseye shooting. We’ll find out over the course of 2018!

Measurement Tools:

Mitutoyo Digital Micrometer/GemPro 250 Digital Scale

A Fair Shake

This year has really gotten away from me. With the tree falling on the house and subsequent reconstruction taking up a great deal of energy, time, and money, there has been little room for doing much more than thinking about shooting. While that isn’t the worst sort of practice, as ideomotor training is valuable, it certainly isn’t as fun as getting out and turning money into noise.

Something has occurred to me over the course of the year that I do need to address here- I’ve changed measurement devices from dial to digital calipers and purchased a scale with more resolution. Both of these changes, in addition to the fact that I’m only as good at measuring as practice will allow, means that I may not have given the Speer, Nosler, or Magnus bullets a fair shake. I’ve amended all measurement posts to indicate what measuring tools were used in the interest of full disclosure. I do plan on remeasuring these various bullets with the new and improved tools and more refined technique, which will bring some consistency across all measurements taken. Like life, there is always a bit of a learning curve.

I certainly do not wish tarnish any company publicly- I’m just a humble scribe reporting what I (think I) have learned. And what I’ve learned is when you change devices and practices, you are going to change the narrative a bit, and it’s simply unfair to not report it.

32 S&W Long BE-86 Analysis

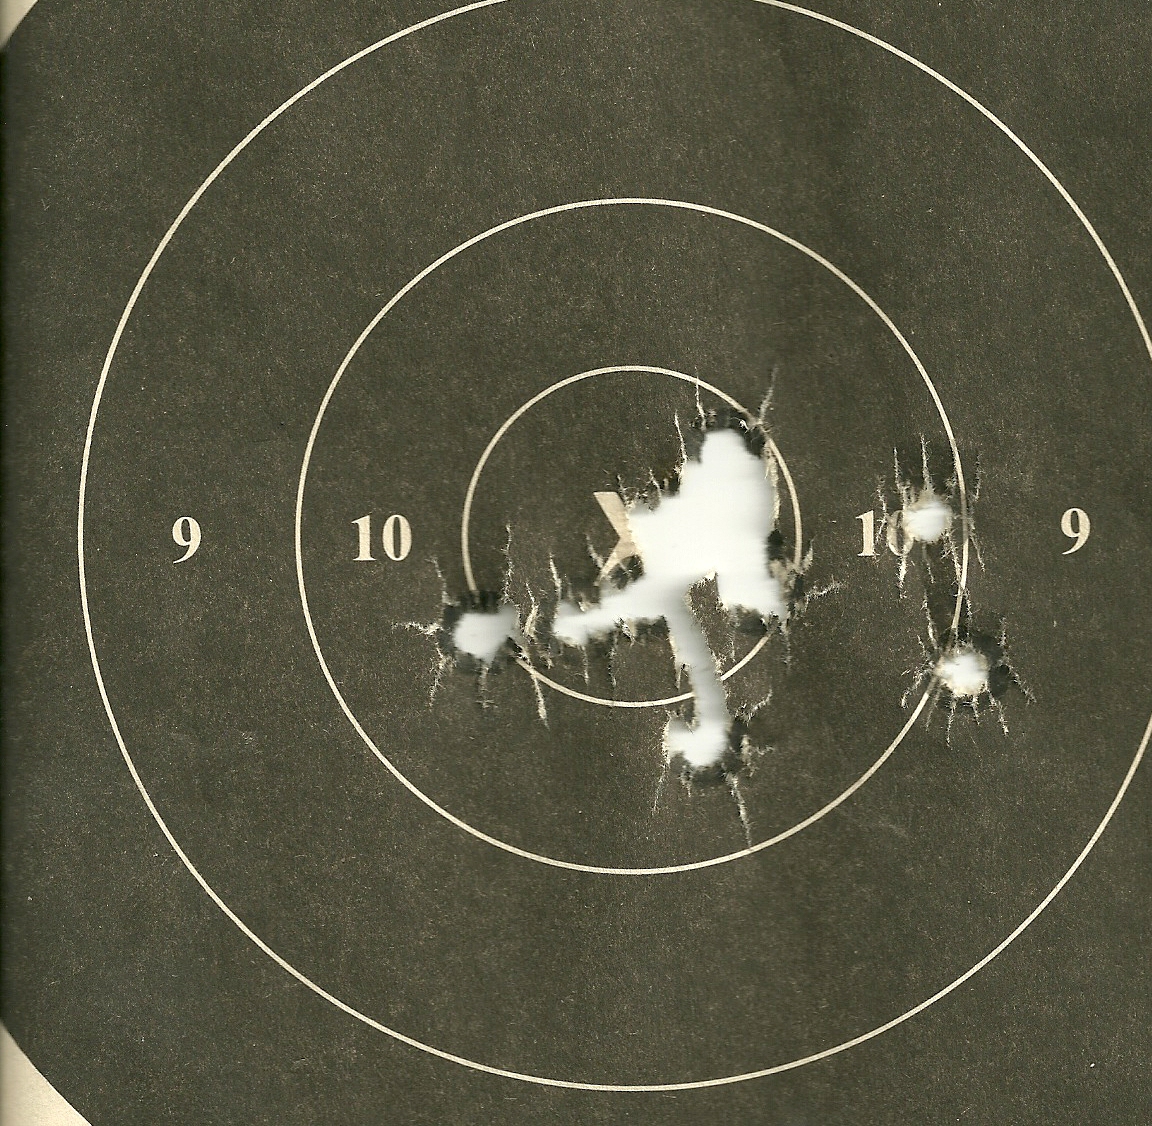
Dave Wilson, considered by many to be the dean of building, accurizing, and shooting the 32 S&W Long, recently offered to make available some test targets with accompanying load data for Alliant’s new canister powder, BE-86. My interest in this data wasn’t so much about the 32 itself, though I’d like to try one, but instead getting my hands on the target data for analysis. If you’ve been around the web watering holes where precision pistol shooters like to congregate, you’ve no doubt seen a Dave Wilson target, like so:

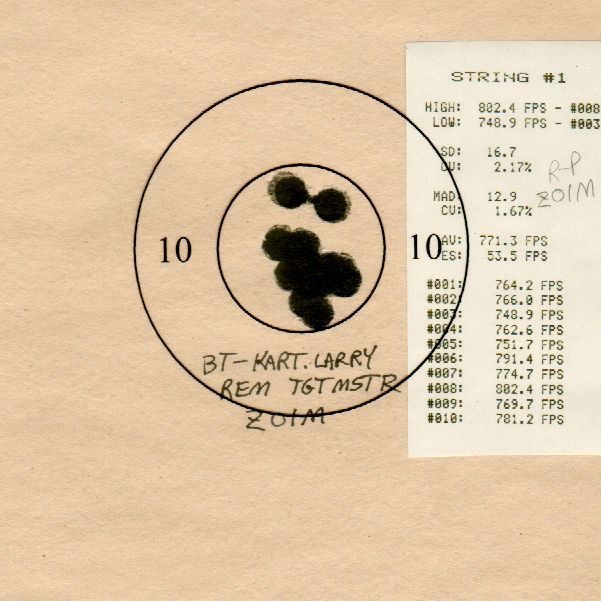
Dave has a barrel testing fixture that he uses for testing ammunition and barrels at 50 yards. He notates the targets with the load data, includes the tape print-out from the chronograph and inserts an appropriately sized bullseye 10/X-ring mask over the center of the target for group comparison. It’s really quite clever and makes analysis easy to sort and review.

Using Dave’s data is the perfect opportunity to investigate the methods and means I’d like to use for the testing I’ve been thinking and writing about here. I’m hopeful that I’ll build a template/process I can use in the future based off this exercise; feedback is encouraged to help refine the reporting, while the data sorting will help me optimize my data collection process.

First, some facts. Dave used an iterative approach in his recent test, starting at 1.55 grains and ending at 2.35 grains. He shot ten shots per target per charge of powder. So, ten shots of 1.55 grains, ten of the next and so on. There are eight different charge iterations, for 80 shots total. I built a small table in Excel, you could use OpenOffice if you prefer, for capturing the amount of grains, the average velocity of ten shots per charge of powder (FPS), the max spread (ES), and the group mean radius. I collected the group mean radius dimensions using TargetScan, an Android/Apple application available on the Google Play/Apple marketplaces. The app costs about 10 bucks, and my experience with it, albeit limited, has warranted the cost. I printed out the targets that Dave sent over and cut out the bullet holes from one copy and transferred the bullet “holes” to a 50 yard repair center (the application expects white holes in a beige/black background to score properly) to run through the app. I’d then index the cutout bullet holes and position them to represent the next target, snap the picture, and repeat until I had all 8 targets completed. This took a little while, but really, it was free data, so I couldn’t complain.

The aggregate score of 80 shots was 795-52X (99.4% – two-tenths more than the National Record held by Hershel Anderson; this raises an interesting question, did Hershel find the theoretical limit of human performance from a probability point of view? ). The mean radius of 80 shots was .901″. I’d say the barrel/ammo/fixture can shoot.

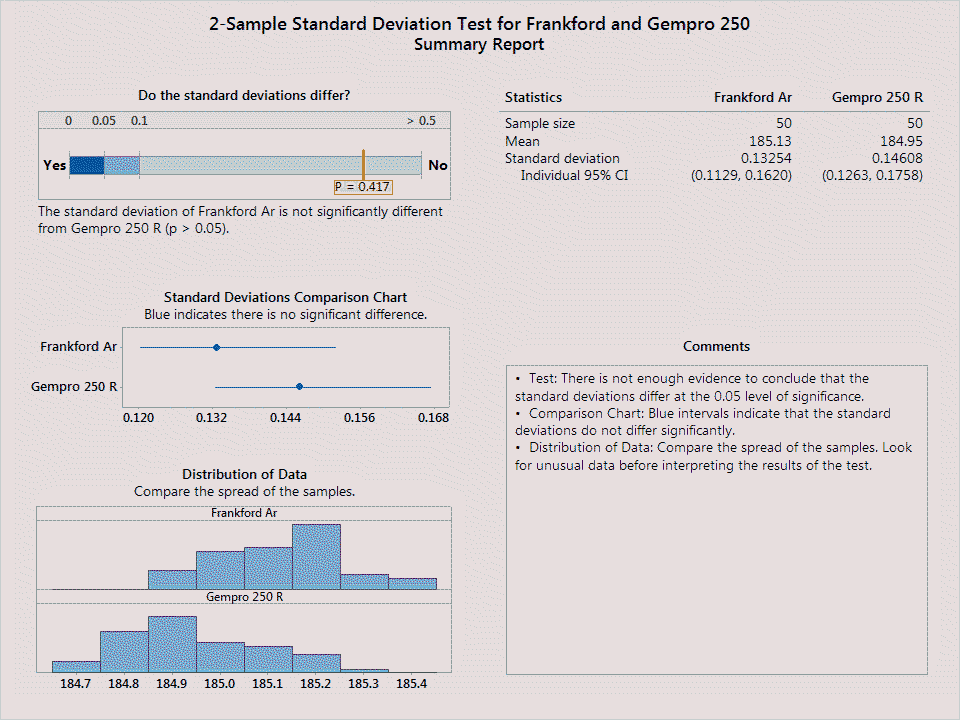
Before I continue, I need to inform you of a note of disclaimer that Minitab had to say about the sample data that I used. Minitab dutifully reports: “Your sample size (n=8) is not large enough to provide a very precise estimate of the strength of the relationship. Measures of the strength of the relationship, such as R-Squared and R-Squared (adjusted), can vary a great deal. To obtain a more precise estimate, larger samples (typically 40 or more) should be used.” With this in mind, do be aware that the conclusions I derive are based solely on the data presented, but are also limited in predictive ability due to the number of targets I had for analysis. That said, I think there is enough data here to make a few meaningful comments, but do keep the limitation of sample size in mind as you go along.

To begin, I wanted to test and see what sorts of relationships existed in the data that should be there.

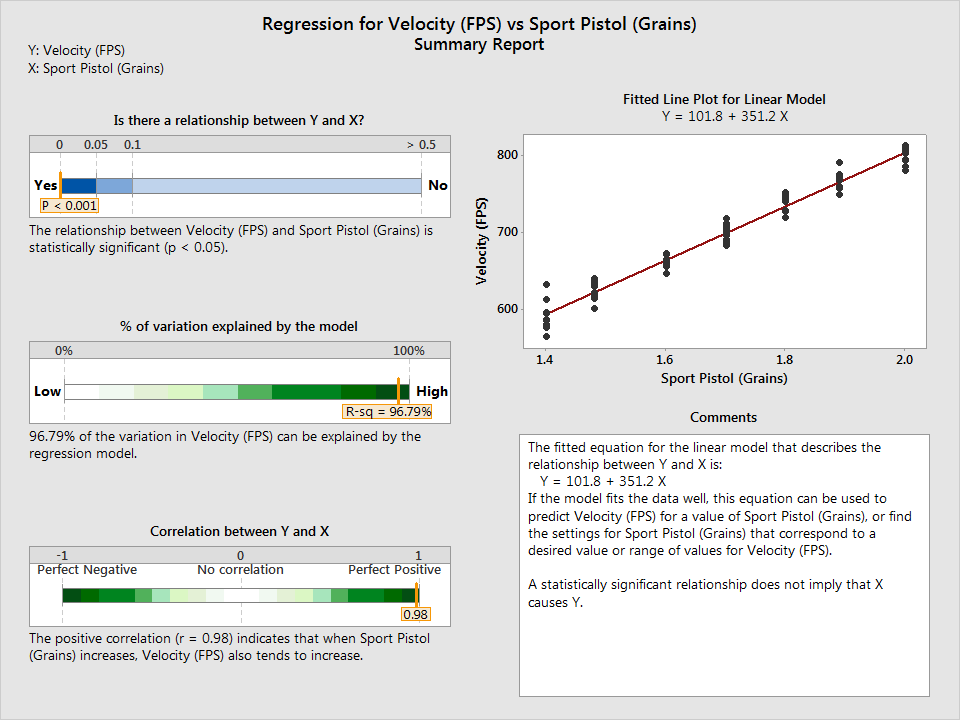
  • Increasing the powder charge, the faster you can go.
  • The larger the extreme spread of a group, the larger the mean radius.
  • The lower the score, the larger the mean radius.

These are intrinsic relationships that should exist in the system and are fundamental to how we think about accuracy. These are testable criteria, and any good combination of load and pistol, coupled with ideal test conditions, should demonstrate these principles.

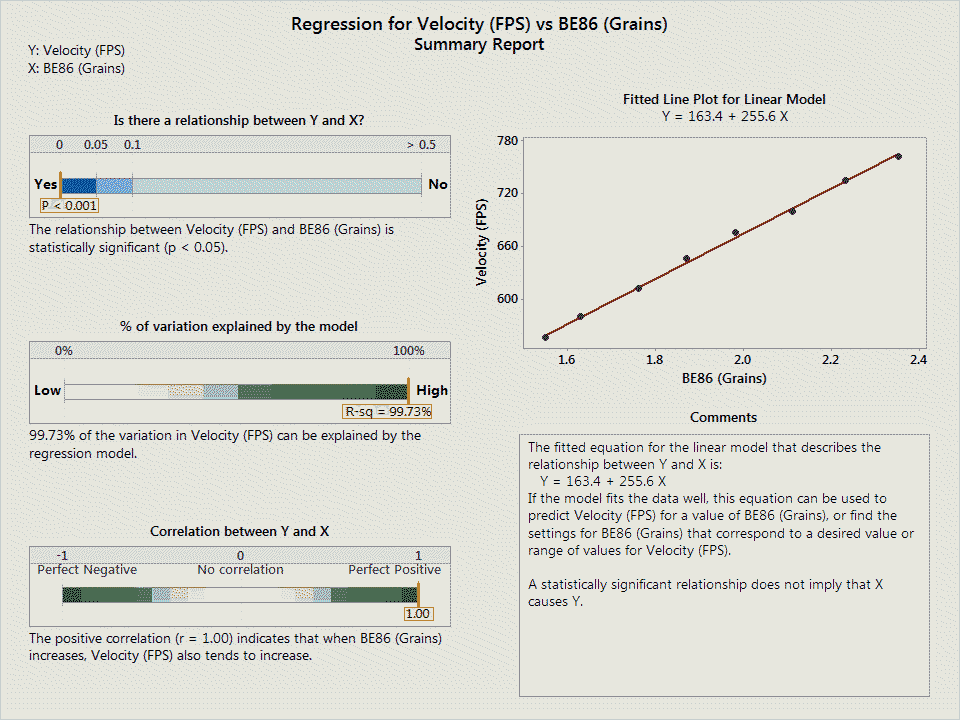
The first relationship, by increasing the powder charge, the faster you can go, is obvious. More propellant, within pressure limits of course, will always equal more velocity. I wasn’t disappointed here; the more powder used increases velocity and demonstrated the strongest relationship out of all of the regression tests performed.

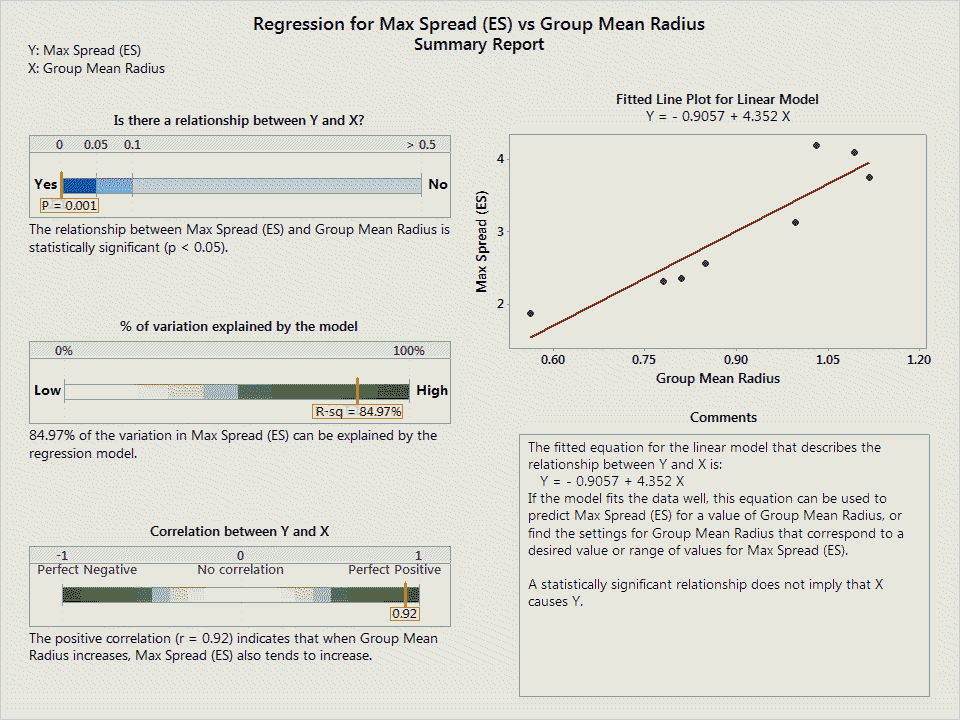
The second relationship, the larger the extreme spread, the larger the mean radius, was also strongly demonstrated in the data. These are two different methods of determining group quality; the extreme spread method of measurement relies on using the two outermost strikes to determine the group size while the mean radius method of measurement takes the average of all bullet strikes using the calculated center of the group taken into account as a point of reference. Even though these are different methods of measuring group size, they intuitively correspond to one another; if a group has a large extreme spread, it should also be the case that the mean radius should also be larger (to account for that increased spread).

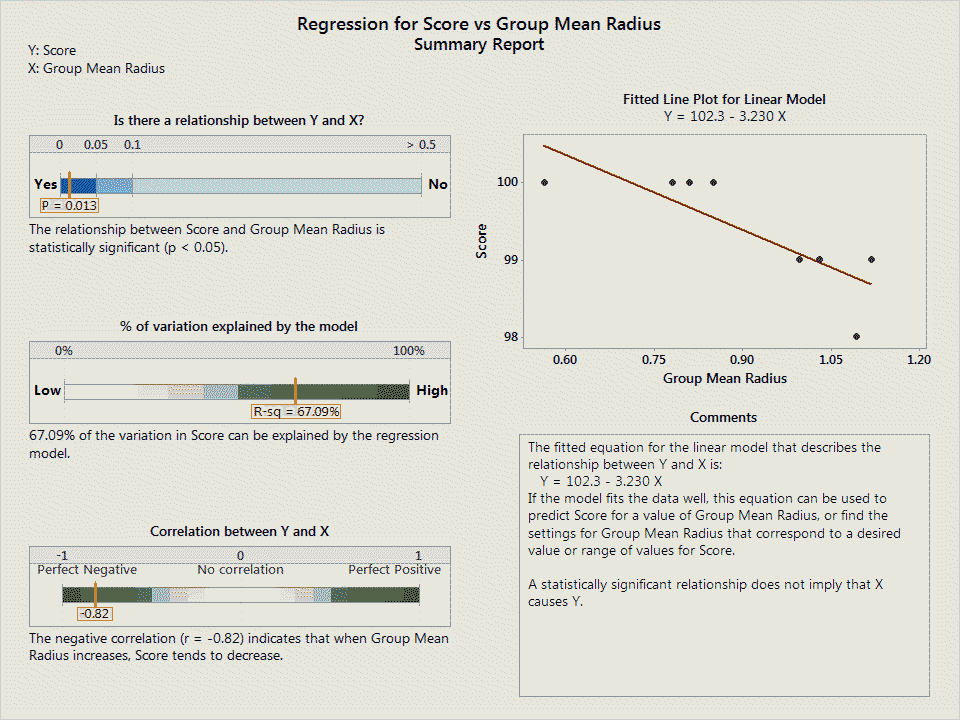
The last relationship is generally trying to capture the notion that a lower score has a larger group mean radius. That is, all things being equal, a lower score will have a larger group. Of course, you could have a theoretical group size of .452″, or the perfect, one shot group, but unless that group is located in the X or 10 ring, and instead is located in the 7 ring, it simply won’t be considered a good group due to poor scoring. Otherwise, a good group should be small and delivered to the target in the center of the scoring area for maximum quality.

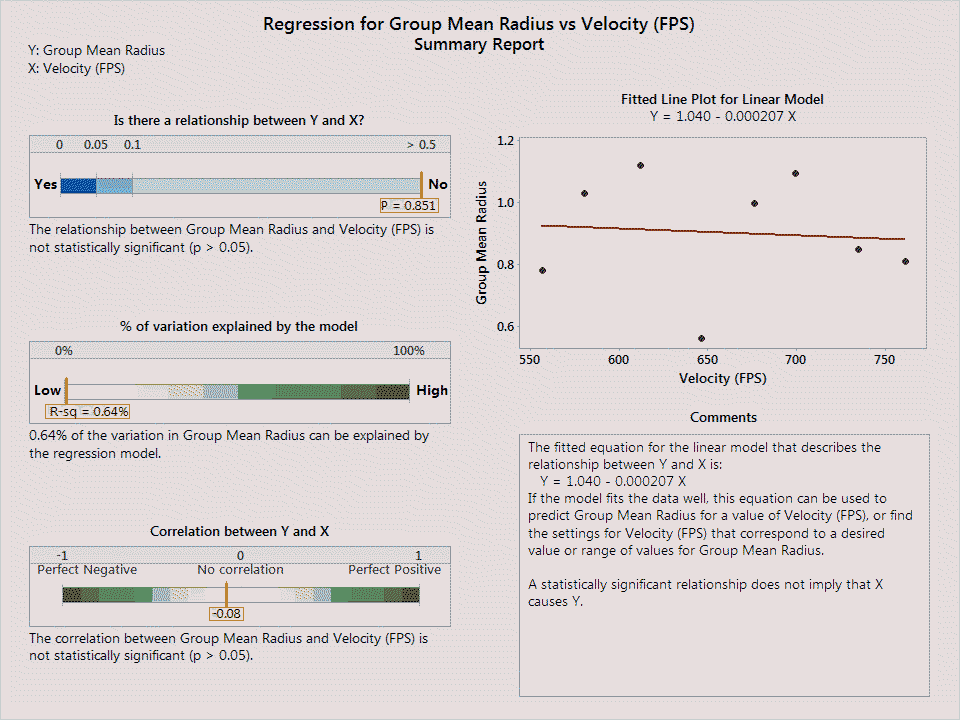
Interestingly, there is no relationship between velocity and mean radius:

Nor does there appear to be a relationship between velocity and extreme spread:

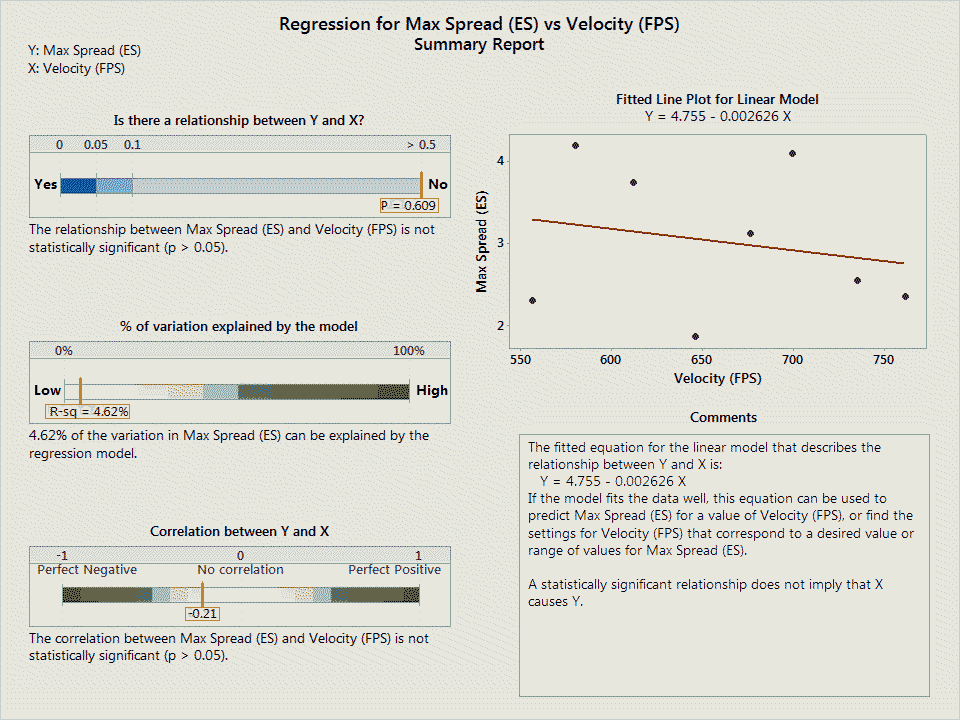
There could be many reasons no such relationship is apparent, though exploring them presently is beyond my remit.

Where does this leave us? It’s nice to know that the data presented seems to be of good quality and makes sense, but how would we determine which particular load to pick as being “the best” or that we should explore further? I believe using the mean radius measurement is the best measure as it gives some structure to the decision making process, removes the extreme spread measure which relies on the two worst shots to tell the story, and is statistically rigorous enough that it can be used as a mark of quality. Plus, with the TargetScan application, determining the mean radius is completed as quickly as snapping a photo.

Once you collect the relevant data, you can make a simple line chart:

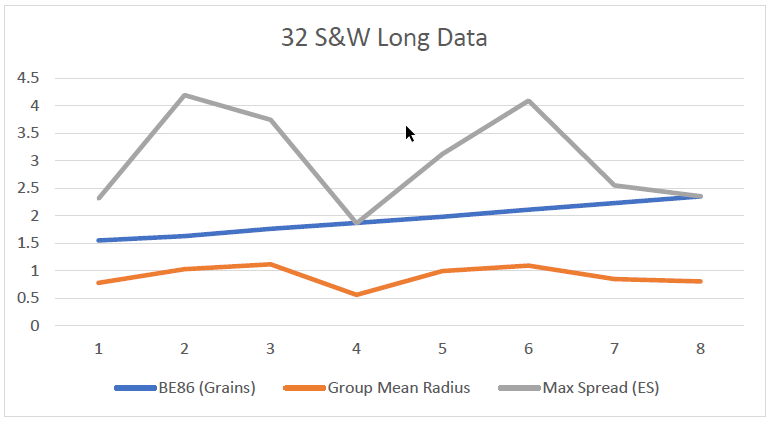
In this particular case, I’d further explore load number 4, as it had the lowest mean radius.

Final points:

  • There does not appear to be a relationship between group size and velocity.
  • The velocity data is spooky in how well it matches the modeling.
  • This data starts to give one the impression of what is possible out of this kind of test fixture, though says little about offhand shooting.
  • From a scoring perspective, the worst ten shot string was a 98 while the best was 100.
  • The relationships one would expect are in the data.

Thanks to Dave Wilson for the data!

Frankford Arsenal versus Gempro 250

Have you ever wondered if your reloading scale was accurate? If so, you’ve probably wondered how do I really know if my scale is telling me the truth about powder or bullet weight when all I have to use to check and calibrate the device is a small check weight which was made by the lowest bidder, somewhere overseas.

It doesn’t really matter if the scale is analog, like an Ohaus 10-10 beam scale, or if it is digital, like a Frankford Arsenal or a Gempro 250. Basic physics is still being used to derive a result, whether it be purely magnetic-mechanical or the result of a load cell’s capacitance which is then in turn interpreted into a numerical result. Certainly, precision metrology relies on traceability to some known standard. The folks at the flavor lab at Coca-Cola, for instance, aren’t using your average kitchen scale when they are working on a new flavor and need to measure out components.

Of course, we aren’t Coca-Cola, but we still would like to know if our scales tell us what is true. There are a couple of ways one could go about this: paying to send off your scale to be calibrated at a calibration lab, purchasing a quality mass standard and using it for calibration, or working at place with a known good scale and using something of your own, say a bullet, to be measured and then used as your standard. Another manner, and the one I’ve elected to use, is to compare multiple scales using the same samples for measurement and seeing if there is a difference (or not) between them.

I own two different digital scales, the Frankford Arsenal 750 and the Gempro 250. Besides cost, the major difference between the two is in resolution. Put simply, the amount of resolution is the amount of precision that the scale can achieve. This can be deceptive; just because a scale can tell you that a bullet weighs 185.1 grains or 185.09 grains isn’t always significant. For our use of checking powder charge weights, what we really want to know is the measurement of powder to a tenth of a grain, as that is how most reloading manuals are presently written. There are use cases where more precision is necessary for success, such as long range shooting, but for bullseye purposes, we need not be concerned with more than a tenth of a grain; instead, we should instead be concerned with whether the press or technique we use to measure powder is itself consistent, with as little variation as possible.

A brief note on why I have two different electronic scales is in order. I purchased the Frankford Arsenal first in order to get up and running (I had sold my PACT scale I used for shotshell reloading some years ago). I like it fine, but I would prefer something that didn’t utilize batteries and I can keep plugged in, so I picked up the Gempro 250 when it went on sale.

I took 50 projectiles and weighed them across the two scales on the same day and in succession, so as to capture statistically similar conditions for analysis.

Frankford Arsenal v. Gempro 250

What you see here is that there is no significant difference between the two scales. It does appear that the Frankford Arsenal scale tends to weigh items a bit heavier than the Gempro 250, but that’s all you can really tell- and only then by about tenth or two of a grain.

In sum, there really is no difference in these two scales and both will work equally well for measuring reloading powder charges, sorting cases, or sorting bullets. What will be interesting is to run this analysis again, throwing in a mechanical scale into the mix. More to come!

Sierra Sports Master #8800 JHP 185 GR Quality Measurements

In an email exchange with Dave Salyer regarding handloading for Bullseye, he made mention that when using Nosler JHPs he had found a half inch improvement in group size at 50 yards when using new cases compared to mixed cases. This has me thinking two thoughts: 1) that case tension when new could potentially be a factor in attaining accuracy and 2) that bullet choice should center on a JHP bullet for optimal results.

With Dave’s mention on the brain, I purchased a bunch of different match grade bullets and have been slowly measuring them and sharing the results here. I believe that by measuring them I should be able to tell at least two things: 1) whether or not the bullets were statistically consistent and 2) try to determine if the measurements I found from the Nosler JHP were also present in other makers offerings.

It appears that the Sierra Sports Master, model #8800, exceeds the beloved Nosler JHP in standard deviation (SD) of both weight and length and may be an idea candidate for a 50 yard load. This assumes that a lower SD (in these areas) is conducive to best accuracy.

Diameter:

Measurements taken were weight, length, and diameter (in that order). At first, I was a bit baffled by my measurements- I even got out the micrometer to check, but these bullets, as the specification sheet indicates, do in fact measure .4515″ at the base. There is a slight outward taper below the ogive from .451″ to .4515″ at the base, but it is there.

Length:

You won’t believe this, but there were only two different lengths captured in my sample of 50: .536 and .537 inches.

Either I just measured 50 of the most consistent bullets so far, or something was wrong in my measurement process. As near as I can tell, both my technique and equipment is no different than previous studies. These bullets are incredibly consistent in terms of length- a single thousandth of an inch being the only difference between the bullets in the sample.

Weight:

The probability plot indicates that the sample weights were normally distributed, save for an outlier:

The summary report indicates that the mean and median are the same. The report also indicates that the SD is .18 grains, more than half smaller than the Nosler weights reported back in March. Lastly, I’m pleased to report that the Sierra bullets I measured here are on average 185.09 grains- meaning you actually on average getting what is claimed on the box.

Relationship Between Weight vs Length:

A regression analysis indicates that there is some relationship between weight and length, but that they are not particularly strongly related with one another, as Pearson’s coefficient is a modest 16.91%. This is most likely due to only two lengths to model the evenly distributed weights.

Conclusion:

In general, these bullets appear to be well made and arrived in excellent shape. On average, these bullets are slightly overweight. These bullets have had the lowest standard deviation in weight of any bullets measured thus far, and the consistency will not be a detriment. These bullets appear to be constrained in terms of their length, as they have been the most tightly spaced of any measured thus far. Like the Nosler JHP, this tightly controlled length may help keep bullet seating repeatable and crimping consistent. This in turn may explain why these bullets will be excellent performers for 50 yard bullseye shooting.

Measurement Tools:

Mitutoyo Digital Micrometer/GemPro 250 Digital Scale

Magnus #801 185 GR Quality Measurements

Terry Labbe is a High Master shooter from Alabama and is the proprietor of Magnus Bullets. He makes his way around the Southeast bullseye scene, shooting lights out wherever he goes. I met him at the 2016 GA State Shoot after calling and placing an order for his #801 (185 GR Button Nose) and #802 (200 GR SWC) cast bullets to be delivered at the shoot. From the phone call I thought he was a affable fellow; meeting him in person did not disappoint.

After playing around with other cast bullet providers, I thought it was incredibly short sighted on my part that I wasn’t supporting a guy one state over who shoots his own product- with excellent results. In my defense, I didn’t know about Magnus until visiting either the bullseye forum or the mailing list, so while I might be late to the party, I did finally arrive! I like supporting folks invested in their business, and the quality of Terry’s bullets speak for themselves.

Diameter:

Measurements taken were weight, length, and diameter (in that order). I found very quickly that I was unable to discern much diameter difference- it’s entirely possible that there is a difference that a micrometer could tell, but the calipers I was using all turned up measurements of .452 inch in diameter.

Length:

I had some outliers in my length measurements:

It is entirely possible that the outliers were due to faulty measuring on my part. I did find that, depending on how you rotate the bullet around its axis, you can find yourself coming up with different measurements; you should also be aware that the sprue on the bottom of the bullet can distort the length measurement.

I always choose the longest measurement by turning each bullet a quarter turn and then taking a measurement; whatever is the longest is the one recorded. I did not have to do much rounding up or down- most every measurement was right on or near a graduation. Nevertheless, it is entirely possible I introduced bias, though I took great pains to avoid doing so.

In general, however, the length of the 801s I measured were evenly distributed:

Another view of the same data:

Weight:

The weight recorded across the sample lot of 100 had a median value of 185.28 grains and a mean value of 185.26 grains. Finally- a manufacturer that actually meets specification instead of hiding material savings in process control!

To be fair to other manufacturers- I’m not making the claim that I can tell the difference between 184.4 grains and 185.5 grains; all I’m saying is that I’d like to get what is listed on the box most of the time.

Lastly, I hope that a pattern is becoming clear about the various manufacturing methods bullet crafters employ- we’ve seen a electroplated bullet, a cup and core bullet, and now cast. Last on the list is the swaged variety- any ideas what that data is going to look like? Stay tuned!

Relationship Between Weight vs Length:

A regression analysis indicates that there is a relationship between weight and length, which is fairly strong, though it would be better if Pearson’s coefficient was 65% or greater, instead of 50.4% that the data supports. That said, if I reran the analysis without the outliers, I’d probably see an increase that might approach 65%.

It’s also important to note that Pearson’s coefficient isn’t the only criteria by which any bullet in particular, and this variety specifically, should be measured or critiqued.

A strong relationship between length and weight, especially when diameter is constrained, is what passes the sniff test here. If there wasn’t such a relationship, you’d naturally wonder what was causing such variation- no such wondering is needed here.

Conclusion:

I’ve shot a couple thousand of these and can’t say enough good things about them. Terry has shot 2658 with his lead bullets, so I should think they’d be good enough for anybody!

While bullet technology has advanced, using electroplating as an example, it still stands to reason that a cast bullet, made properly, will get the job done- and in this case, your money is supporting someone who supports the sport- how can you beat that?

Measurement Tools:

Brown & Sharpe Dial Micrometer/Frankford Arsenal DS-750 Scale

Nosler JHP 185 GR Quality Measurements

When I think about the big bullet companies, I think of metal(s) futures contracts, sales, supply chains and manufacturing- probably in that order. Planning the desires of the company, making those hopes and dreams come true, a way to build what is necessary for them come true… well, it’s enough to boggle the mind. Winchester, or Olin Corporation, is an integrated metals and chemical manufacturer. Did you know they make a lot of chlorine? They also sold their brass business back in 2007.

Nosler is not as large any of the big three, and was founded around the time Hornady and Speer got their start. Nosler is still a family owned and run company in Oregon- I’m not sure if it is 2nd or 3rd generation at this point- and they are well known in the bullseye community for making P/N 44847, a 185 grain jacketed hollow point bullet, that became somewhat famous due to it’s use by the Marine Corps pistol team.  Based on this reputation alone, I sought out a couple of boxes and finally sat down to measure a few.

Diameter:

Measurements taken were weight, length, and diameter (in that order). I found very quickly that I was unable to discern any diameter difference- it’s entirely possible that there is a difference that a micrometer could tell, but the calipers I was using all turned up measurements of .451 inch in diameter.

Length:

I had some outliers in my length measurements:

Now, it is entirely possible that the outliers were due to faulty measuring on my part. I did find that, depending on how you rotate the bullet around its axis, you can find yourself coming up with different measurements. I always chose the longest by turning each bullet a quarter turn and then taking a measurement; whatever was the longest was the one I recorded. I did not have to do much rounding up or down- most every measurement was right on or near a graduation. Nevertheless, it is entirely possible I introduced bias, though I took great pains to avoid doing so.

That said, this data is not normally distributed (though it is mostly evenly distributed) as I keep measurements to .001″. However, it probably would be normally distributed if I could get repeatable resolution to another significant digit- which would be nice, but also expensive.

The bulk of measurements were from .532 to .533- a very narrow band. I wonder what the specification is for the length of this bullet?

Weight:

While the P-value in this case is high, it isn’t as high as that of the Speer TMJ 185 Grain bullets I measured previously. That in and of itself is not an indictment on this particular bullet in general, or this lot (KM06F18-1/150513121312) in specific. All this means is that the weight was normally distributed across the sample taken (50).

You’ll note the same trend here was was seen with the Speer before- on average, the bullet you pull out of the box is going to be lighter than 185 grains. Also, in regards to the weight distribution, the Speer had a better standard deviation than the Nosler.

A note of process change: I’ve since moved to my new forever home and sufficiently warmed up the scale and have kept it in a temperature/humidity stable area, which is different than the place in which I made my previous measurements of the Speer TMJ 185. In due course, I’ll run some gage R&R tests to see what variability my equipment (and technique!) may play in my results.

Relationship Between Weight vs Length:

A regression analysis indicates that there is some relationship between weight and length, but that they are not particularly strongly related with one another, as Pearson’s coefficient is a modest 25.5%.

I think if the outliers were taken out, the regression model would still not be as robust a predictor of weight vs. length. I’m at a loss as to why there isn’t a stronger relationship, other than:

  • Measurement bias in length or weight
  • Bullet construction properties are not represented well in a regression analysis
  • Analysis may in fact be correct, and this is the level of quality to be assumed is aimed for
  • Outliers distorting the data

As more measurements are taken, I’ll be sure to update the results.

Conclusion:

In general, these bullets appear to be well made and arrived in excellent shape. On average, these bullets are underweight, though there seems to be a very narrow band(s) of bullet length that is showing up in the data, which may help keep bullet seating repeatable and crimping consistent. This in turn may explain why these bullets are known for their match quality.

Measurement Tools:

Brown & Sharpe Dial Micrometer/Frankford Arsenal DS-750 Scale